The Scoop Display
The GUI monitoring tool,
Scoop(8), can run on a machine external to the cluster,
or on one of the compute hosts, as long as the Java Runtime Environment with
the JFC component is installed. Scoop communicates with any
number of ScoopServer programs, and displays compute host
activity as a block matrix, as well as compute host resource information as
formatted table data. Scoop users can easily monitor activities
of multiple clusters from a single viewpoint.
Start the GUI monitoring tool from an X terminal window. The main Scoop
window will be displayed as follows:
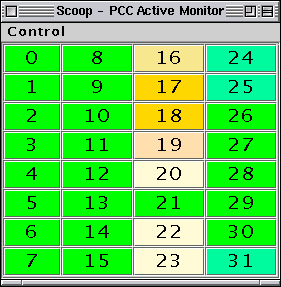
Each compute host is shown as a colored block. In this example, there is a
matrix of 32 compute hosts. The color of the block represents the one-minute
load average (when the -L option is used on the
ScoopServer command line), "green" showing an idle compute host,
leading to "white" for a very active host.
In either case, if a host is down the block will change color to red.
Clicking on a block with the left mouse-button will produce a dialog window
showing the hostname of the compute host. Clicking with the right mouse-button
ping's the host and display a confirmation dialog window.
Sometimes a host will
turn red if information is not received by ScoopServer in a
specified time. You should manually ping the host to
confirm that it is actually down.
The window has a pull-down menu called Control.
Selecting Control with the mouse shows the following
pull-down menu:
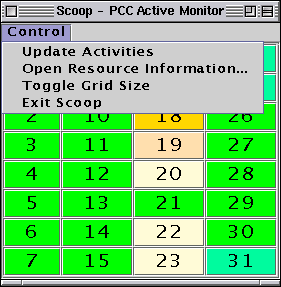
There are four menu items:
- Update Activities - requests an update from the server
- Open Resource Information... - opens a window to
display a table of system resources
- Toggle Grid Size - toggle the size of the block matrix
- Exit Scoop - quit the GUI tool
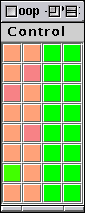
The window can be toggled between the default grid size and a small grid size.
An example of the small grid size follows:
Selecting Open Resource Information... creates a table of
system resources in a separate window. An example is shown here:
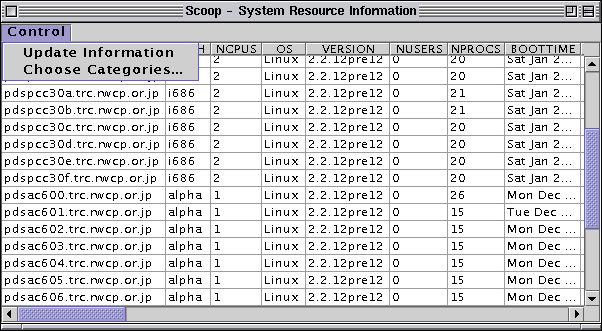
The table shows rows of cluster hosts and columns of system resources. The
example above shows the Control pull-down menu
obscuring two columns called HOST and ARCH,
representing the host name and its architecture. The slider bars can be
used to view other hosts and system resources in the table.
The table above shows a heterogeneous cluster being monitored. There are two
groups of compute hosts, an SMP Pentium processor group with two processors
per compute host, and an Alpha processor group with uni-processor compute
hosts. Both groups are running the same version of Linux.
The pull-down menu has the following items:
- Update Information - requests an update from the server
- Choose Categories... - tailor the display of system resources
You can close the window by killing it from the window manager frame.
Selecting Choose Categories... from the
Control pull-down menu opens the following dialog window:
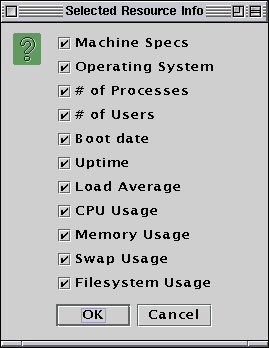
The columns of the table are grouped into categories. Each category can be
turned on or off by selecting or de-selecting the appropriate check button.
For instance, de-selecting Operating System and clicking
OK will remove the OS and VERSION columns from the table.
- CREDIT
- This document is a part of the SCore cluster system software
developed at PC Cluster Consortium, Japan.
Copyright (C) 2003 PC Cluster Consortium.